This page is under development and constantly altered...
Regional risk analysis (Prototype site)
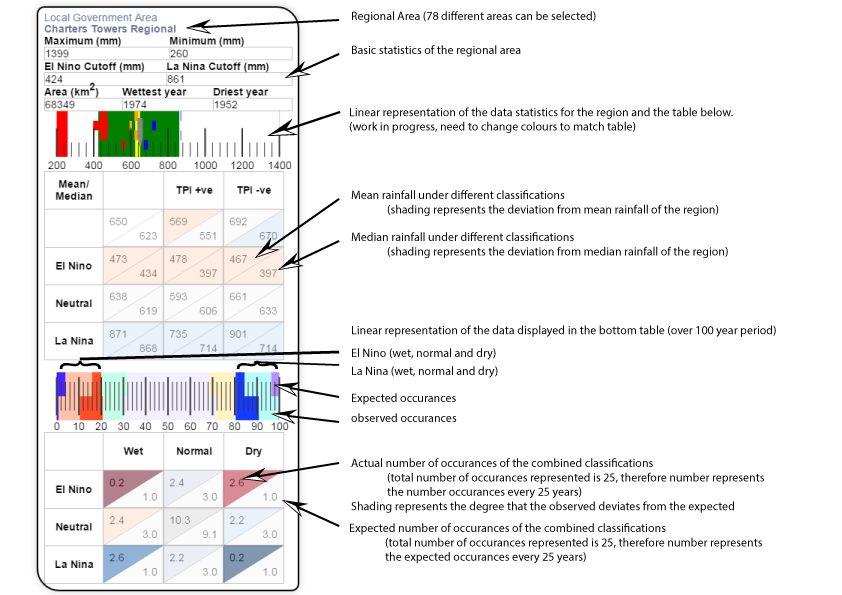
This is an experimental page which aims to allow users to investigate the potential that two climate indices have and the effect on yearly rainfall occurrence.
The map below represents the Local Government Regions (LGR) for Queensland. The regions have been coloured depending on the relative risk that the Multivariate ENSO Index (MEI) has on yearly (April-March) rainfall. El Nino and La Nina events are defined as the bottom and top 20% of ranked values of the MEI, therefore the expected risk is 2:10 years for an ENSO event. To further categorise the events the TPI (IPO) Tripole Index for the Interdecadal Pacific Oscillation is used to stratify the ENSO events intensity.
For further information see Queensland Drought Mitigation Centre. Conceptually based on Risk of Seasonal Climate Extremes in the U.S. Related to ENSO webpage.
The analysis was to rank Multivariate ENSO Index (MEI) and define the top 20% of the index as La Nina and bottom 20% as El Nino ENSO events. This is then compared with the ranking of area averaged monthly rainfall (SILO climate data) for all the LGR's in Queensland. The expected ratio of years in the top 20% of rainfall years to fall within the ENSO event categories is 2:10 years. However, most areas in Queensland have a significant deviation from this expected ratio. This is expressed in the above figure. Rainfall has also been normalised and represented as the Standardized Precipitation Index (SPI), as an alternative to 6 or 12 month running mean.
Info